
Click rate has been the default measure of phishing awareness for years, and for good reason. It is simple, it is easy to explain to a board, and it moves in a direction everyone understands. When you need one number to show a programme is working, it is the obvious one to reach for.
The harder question is whether that number tracks what you care about. Does a lower click rate mean your people are getting better at spotting a real attack, or just better at spotting your tests?
To find out, we analysed a year of phishing behaviour across 123,692 employees in SMB and mid-market organisations. The data showed that click rate is only part of the picture.
Three behaviours tell you more than click rate alone: whether someone clicked, whether they then handed over their credentials, and whether they reported it. One tells you what happened, the next how serious it was, and the last whether they helped catch it.
Why a click rate alone can mislead
A click rate on its own tells you little. If your simulations never change, a falling click rate is not proof people are harder to phish. It could simply mean they have learned the format, sender names or giveaway phrasing, rather than becoming better at spotting a real attack.
If the tests get harder and clicks still fall, that is a different story: people are getting harder to phish, not just better at recognising the tests. In our data, the decline after the six-month peak held while roughly half of all simulations stayed in the Hard band, and that is what made the improvement meaningful. So before you read anything into a click rate, ask what difficulty produced it. The same number can be good news or nothing at all, depending on the answer.
What leak rate tells you about breach risk
Clicking a link and handing over credentials are not the same event. Someone who clicks but stops short of entering their details has avoided the more serious outcome. Credential submission is the point at which a click can become a genuine compromise opportunity, which makes leak rate the measure most closely tied to real exposure.
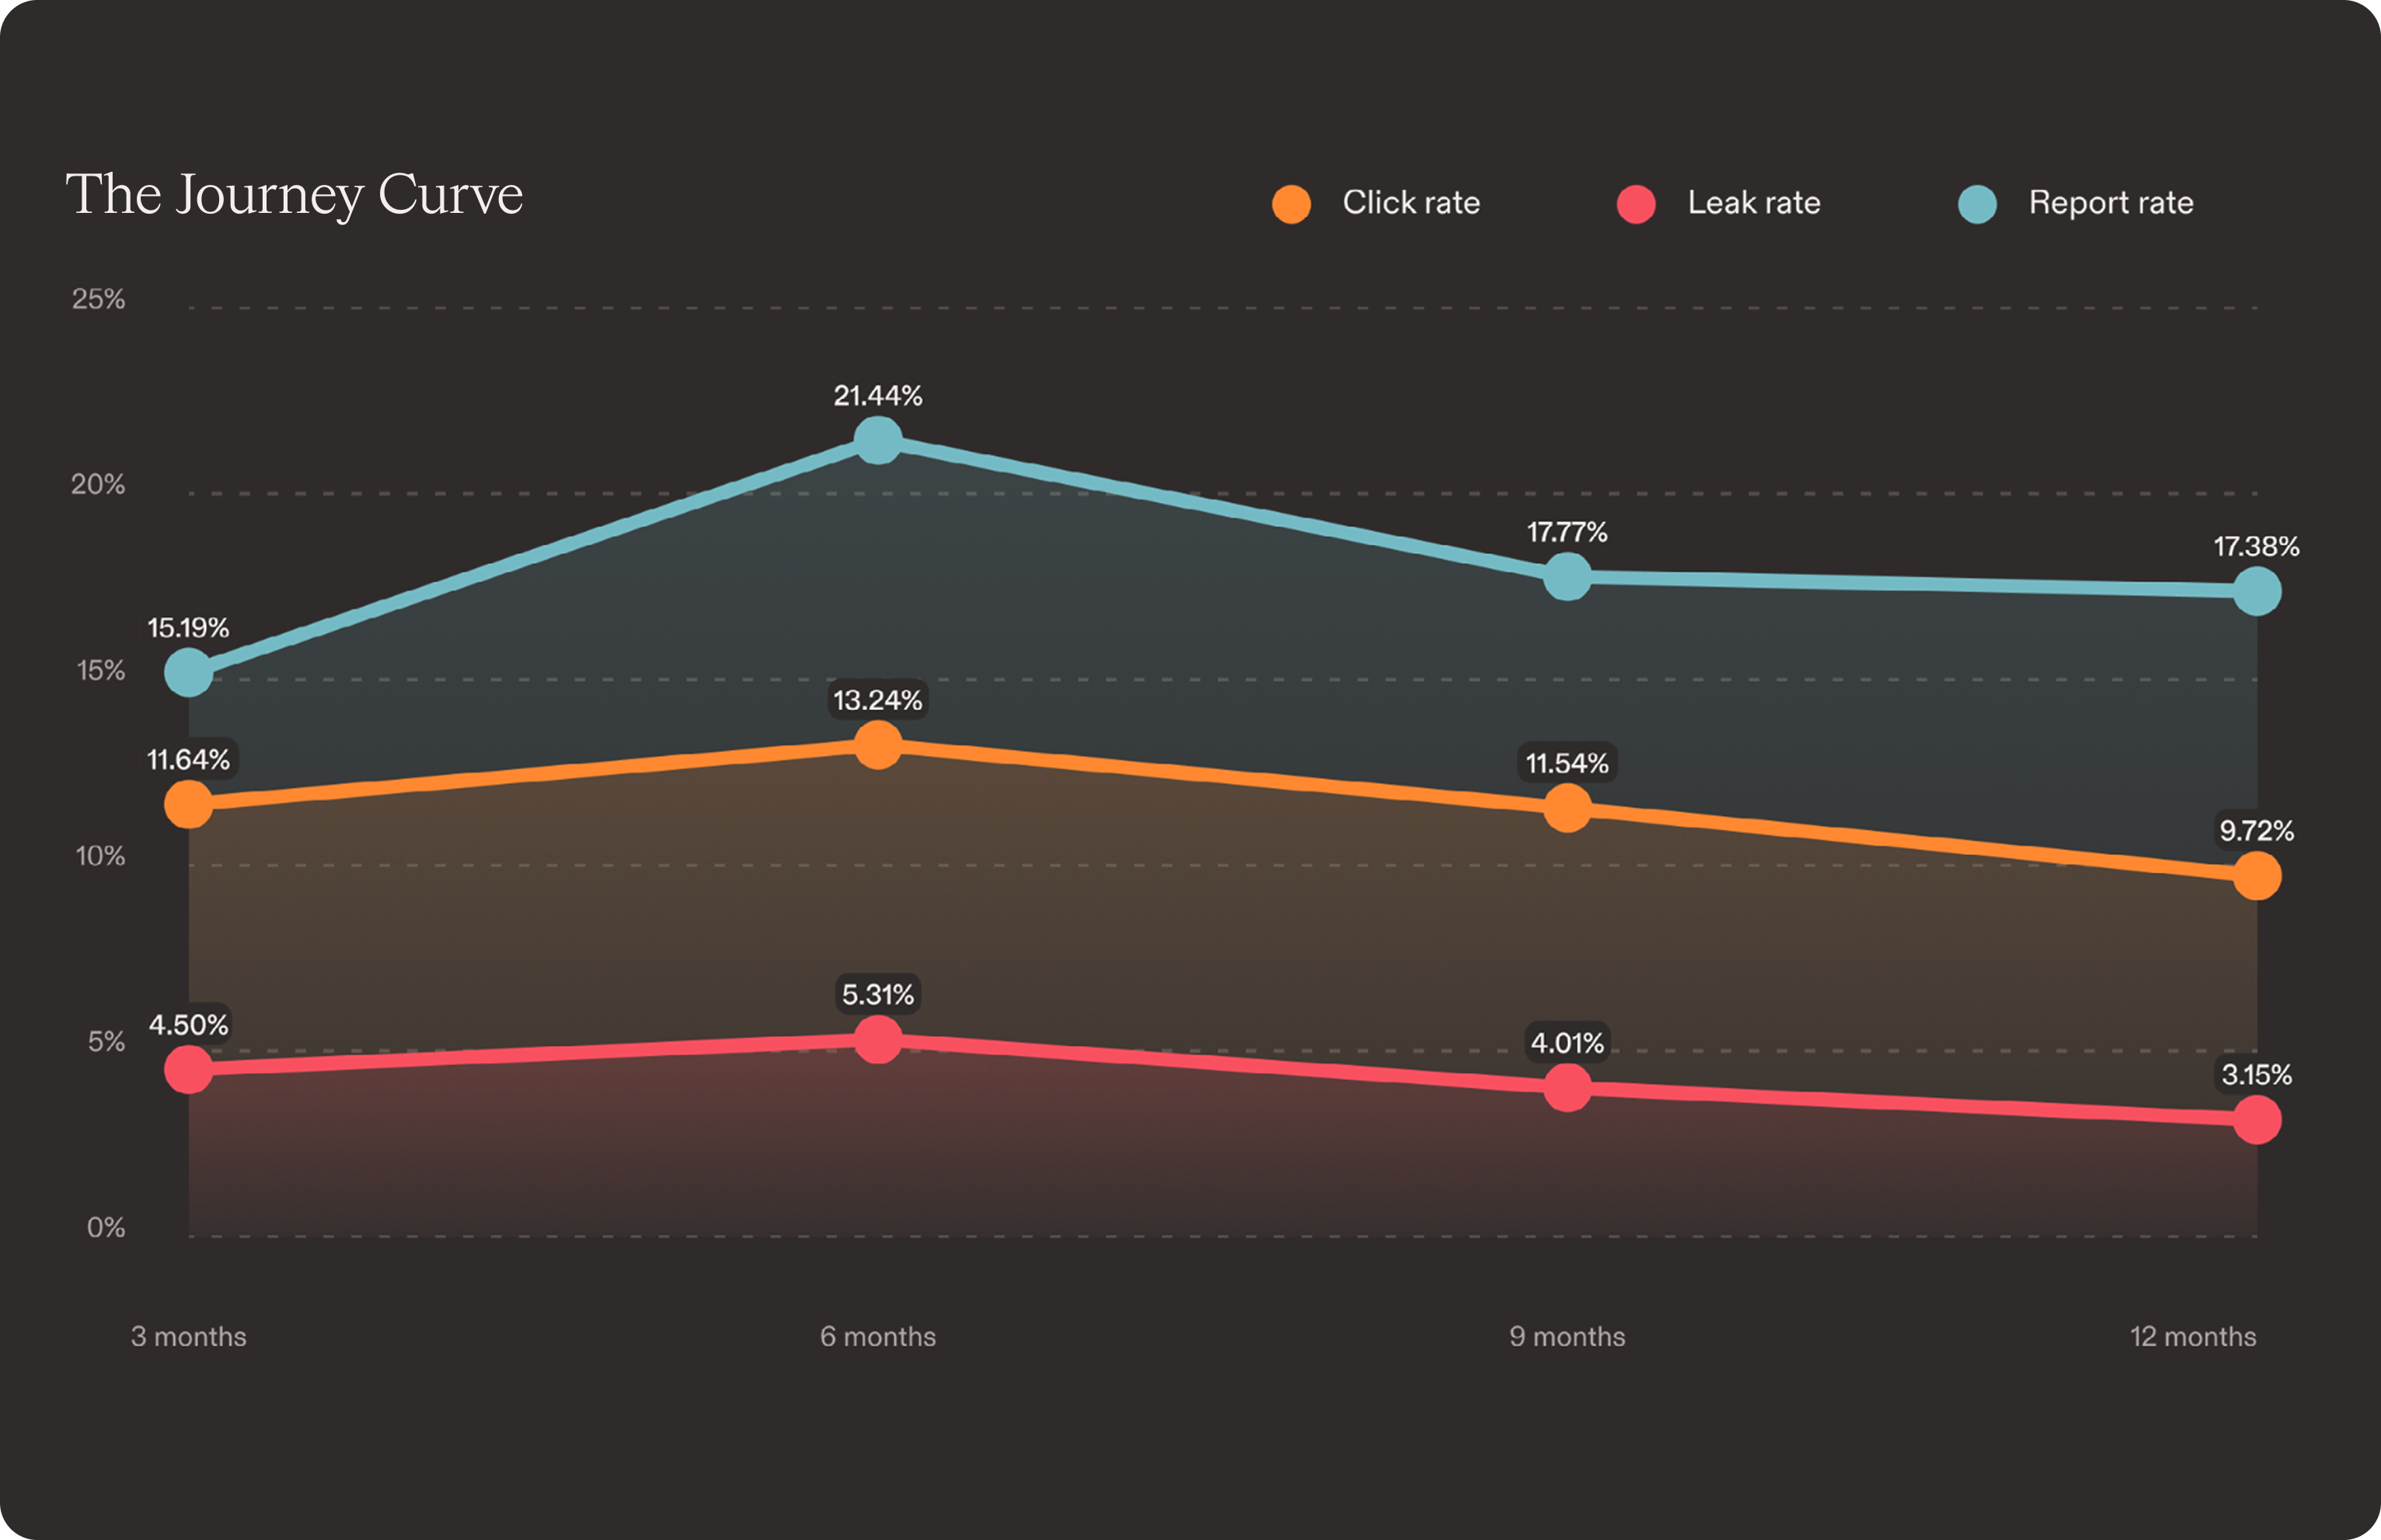
Across most sectors and departments in our data, roughly one in three people who clicked also went on to submit their credentials. So two organisations with an identical click rate can carry very different risk, depending on what happens after the click. Track leak rate alongside it and you learn where your real gap is: are people clicking and then catching themselves, or clicking and handing credentials over?
What report rate reveals about phishing resilience
Report rate is the one behaviour you want to see go up. A reported email is intelligence. It gives the security team early warning and can help them identify the same attack elsewhere in the organisation. People who report are part of how you detect attacks, not just a risk to be managed.
The ratio of reports to clicks rose from 1.3 at three months to 1.8 by twelve, so by the end of the year people were reporting suspicious emails nearly twice as often as they clicked them. A click rate on its own never shows that, because it only counts the thing going wrong, never the thing going right.
Reading click, leak and report rates together
The behaviours only make sense as a set. From the six-month peak to the twelve-month stage, clicks fell 27% and leaks fell 41%, while reports fell just 19%. Clicking and leaking dropping faster than reporting is exactly the pattern you want, because it means people are both more cautious and more likely to raise the alarm.
If you track one number beyond click rate, make it the report-to-click ratio. It captures that shift in a single figure, and because it compares two behaviours from the same population, it gives you a more useful view than either metric alone. A rising ratio is the clearest sign that people are getting more vigilant, not just more familiar with the tests.
Three questions to ask of your phishing data
1. How difficult were the simulations? A falling click rate means little if the tests are getting easier or more familiar.
2. What happens after the click? Compare click and leak rates to see whether people are catching themselves before submitting credentials.
3. Are people reporting what they see? Track the report-to-click ratio over time. A rising ratio suggests reporting is strengthening alongside declining susceptibility.
The metrics that signal a resilient workforce
The organisations that came out strongest in this data share one habit. They treat leak rate and report rate as outcomes to manage, not numbers to glance at once a year. In practice that means difficulty that adapts to each person rather than a fixed library, testing that keeps going rather than resetting annually, and a reporting process simple enough that people will use it.
Download the full report
Download the full Phishing Behaviour Report 2026 to see how click, leak and report rates move together across the year, and where your own sector and teams sit against the benchmark.
Want to see how adaptive simulations can put this approach into practice? Email contact@pistachioapp.com to book a 15-minute demo.
