
Every security awareness programme eventually faces the same question: is it working?
For many teams, the answer starts and ends with the click rate: if it is falling, the programme is working. But in a structured programme, the click rate does not simply slide downwards and reading it that way can tell you the opposite of what is happening.
We analysed a year of phishing behaviour across 123,692 employees in SMB and mid-market organisations. The clearest takeaway was about the shape of the journey, not any single number.
Security awareness is a journey, not a straight line
In the organisations we looked at, click and leak rates did not fall steadily from day one. They climbed through the first half of the year, reached their highest point around the six-month stage, then fell. By twelve months, both sat well below the peak.
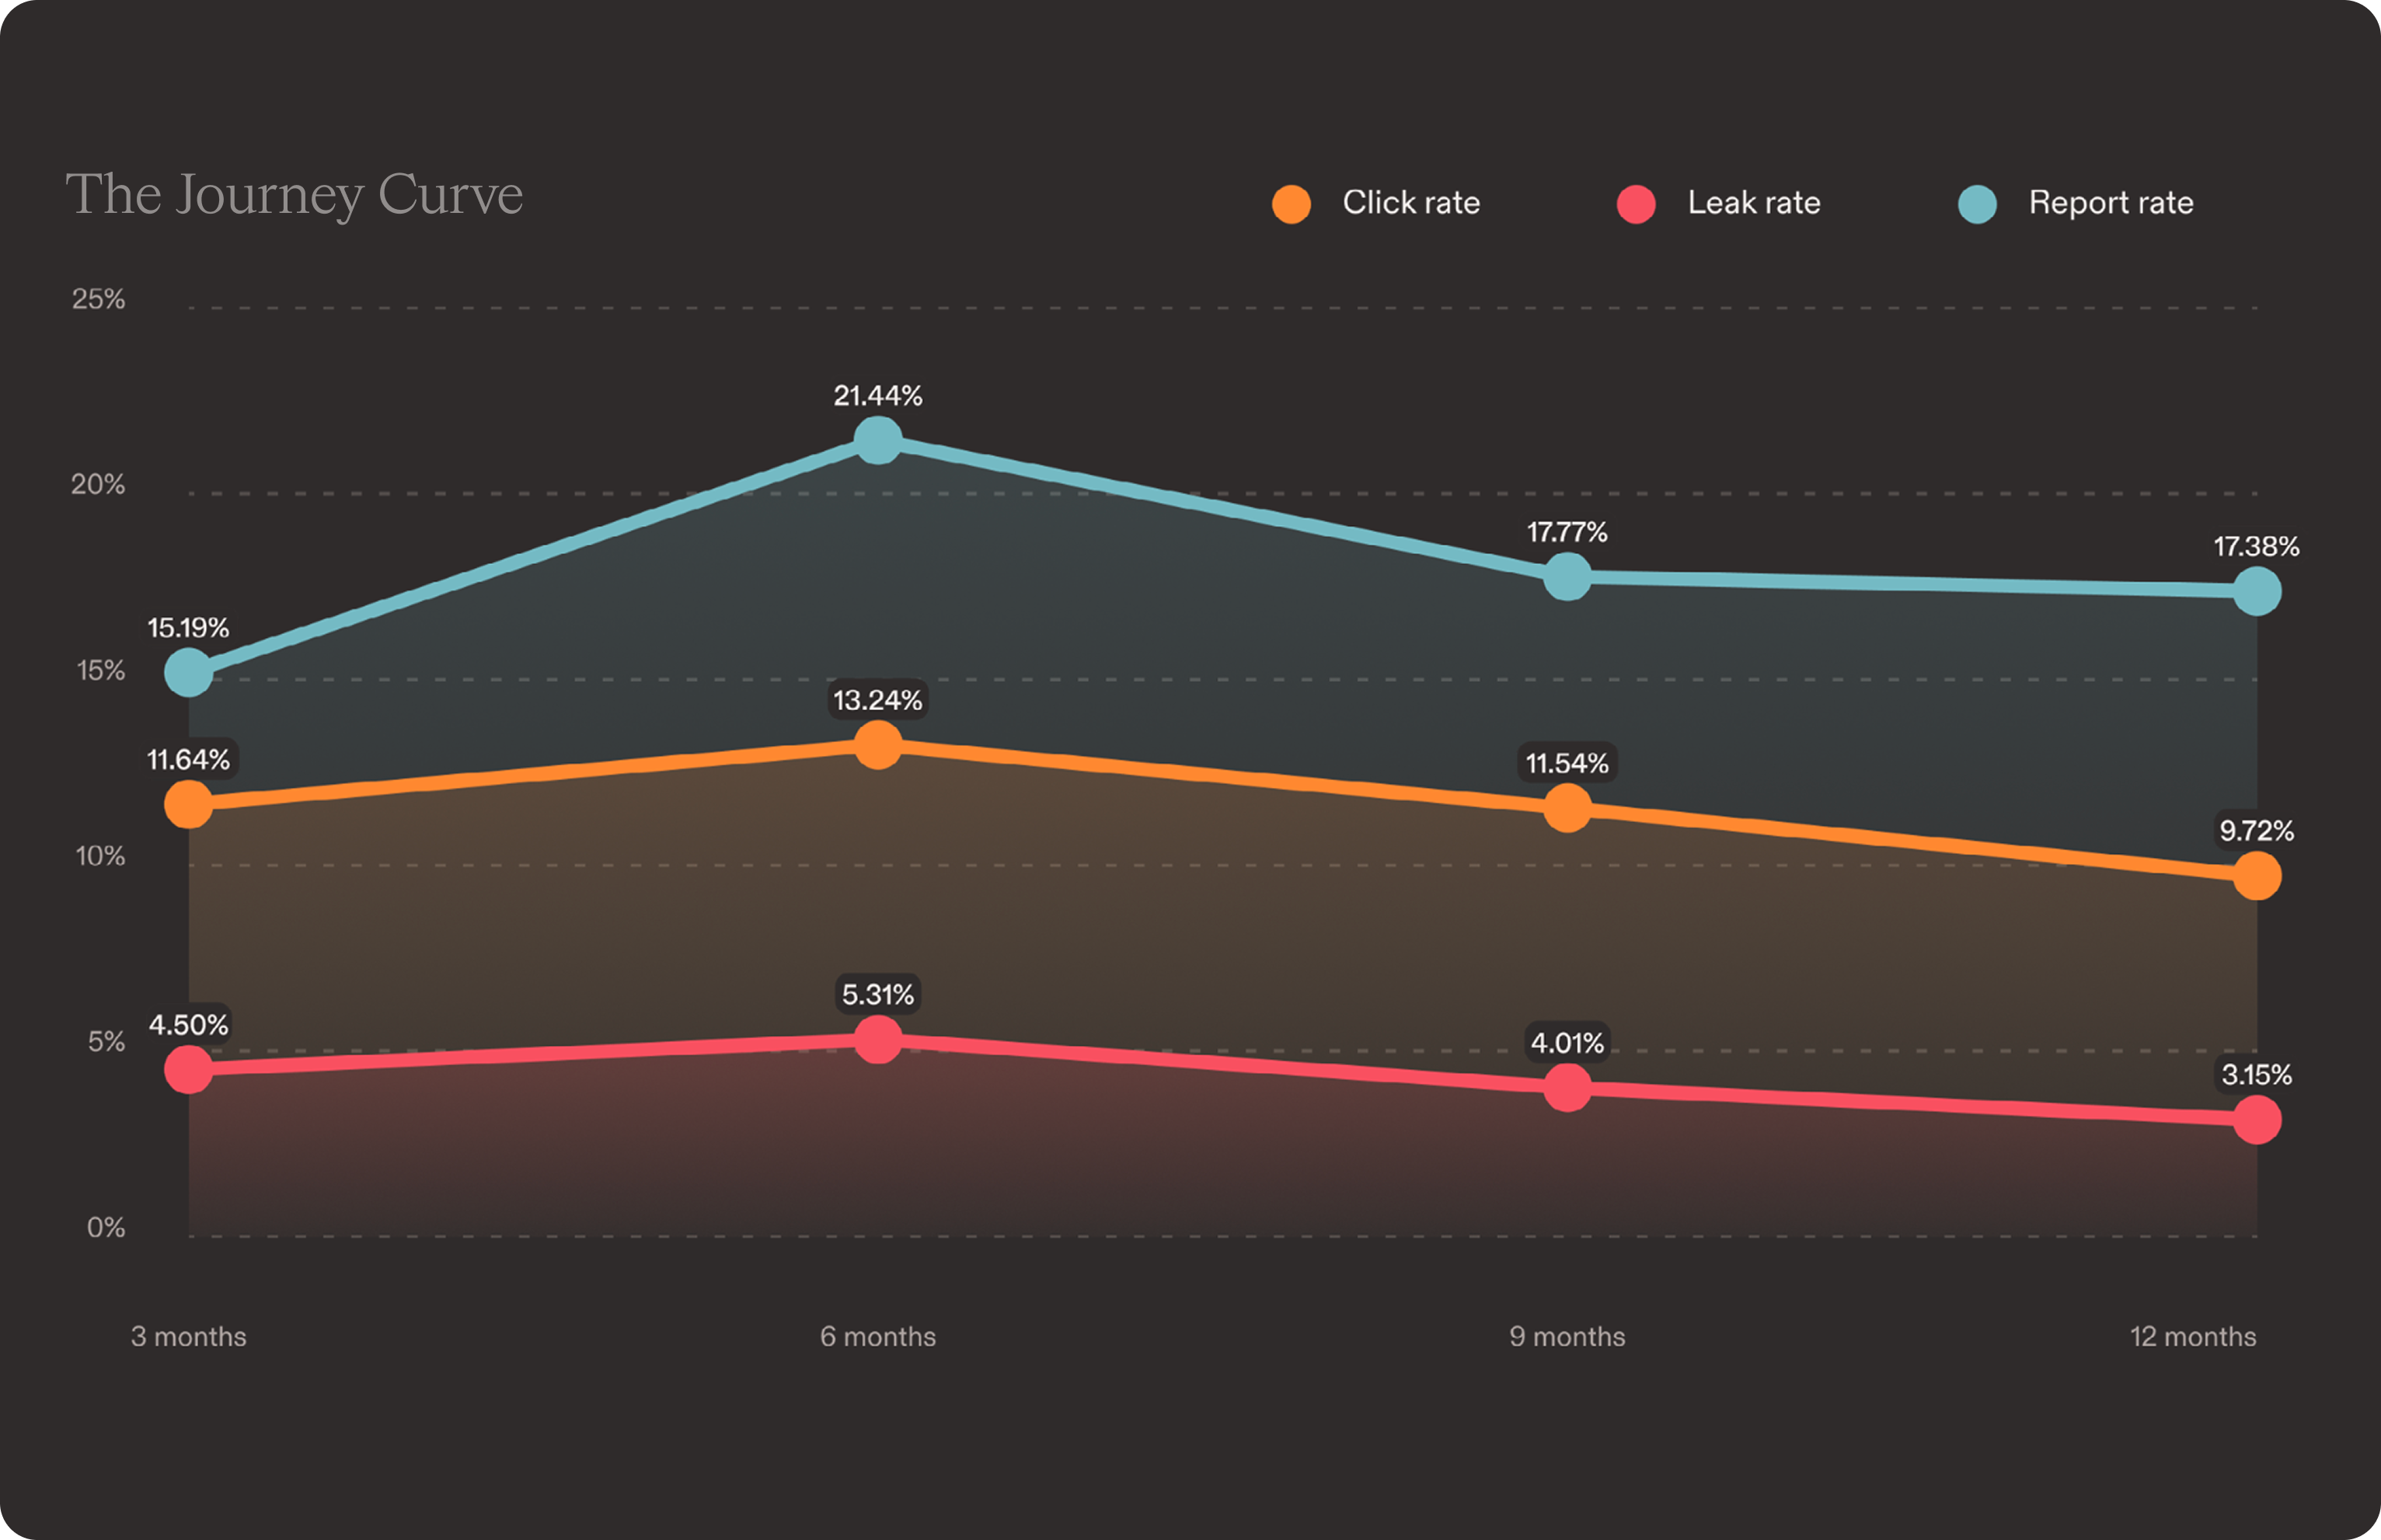
Check a programme at six months and you would see the numbers rising, and conclude it was failing. Look at the same one over the full year and you would see a very different trajectory. Same programme, opposite verdicts, depending only on when you looked.
Why a good programme's numbers can rise
The rise is not necessarily a sign of failure. It is a sign the testing is getting harder.
A structured programme does not send the same easy simulations on repeat. It increases the frequency and difficulty of tests over time, and the six-month stage is where that pressure peaks: people receive more simulations, and a higher share of difficult ones, than at any other point. More testing, and tougher testing, exposes more people to a test they are likely to fail at least once.
The numbers can increase because the programme is surfacing risk that was already there, rather than because people are becoming less resilient. A gentler programme would have left that risk undisturbed and produced a lower, more flattering number, while changing nothing about how exposed the business really was.
Read the trend, and read it against difficulty
This is why a single click rate, on its own, tells you so little. Two things give it meaning:
Time. Judge the direction of travel across the programme, not a single stage, and treat a mid-programme rise as a question worth asking rather than a verdict.
Difficulty. A click rate falling against tests that never change tells you people have learned the format. A click rate falling while the tests stay hard tells you people are improving.
What a working programme looks like
A programme that is working should leave people more resilient to phishing at the end of the year than they were at the start, even if the middle looked worse.
Security awareness is continuous, and so is the picture of whether it is working. The honest way to see it is over time, in context, and especially not from the hardest moment alone.
Download the full Phishing Behaviour Report 2026 to see the complete 12-month journey, and where your sector and teams sit along it.
Want to see what continuous measurement looks like in practice? Email contact@pistachioapp.com to book a 15-minute demo.
