
Most phishing programmes are judged on one question: did the click rate go down? It is the number that lands in the board report, the one that feels like proof the training is working. But a falling click rate can mean something far less reassuring than it appears. It can mean your people have simply learned to recognise the same handful of templates, not that they have become harder to phish.
Whether a falling click rate reflects real resilience, or just familiarity, is the question this report set out to answer.
The data behind it
Over 12 months, 2,473,158 phishing simulations were sent across 1,288 organisations on the Pistachio platform. For this report, we focused on a like-for-like cohort: the 648 organisations with a complete 12-month record, covering 123,692 users. Every finding here is drawn from that group.
That scale matters, but so does who is in it. Most published phishing data comes from large enterprises with dedicated security teams. This does not. It reflects businesses with lean IT functions, mixed office and operational workforces, and the same day-to-day pressures your own organisation runs under. It is a picture of how people in companies this size behave, rather than how a vendor assumes they behave.
Why click rate falls short
Resilience is not one number moving. It is three behaviours moving together: fewer people clicking, fewer people handing over credentials, and more people reporting suspicious emails. A programme that lowers click rate while ignoring the other two can produce a comforting graph and a workforce that is no safer than it was.
The clearest tell is difficulty. A click rate falling against simulations that never change tells you users have memorised the format. A click rate falling while the tests get harder tells you something real is happening. On its own, a click rate says little. Read against the difficulty behind it, it starts to mean something.
Five findings that challenge conventional thinking
The report sets out five findings in full. In brief:
1. Risk is present from day one. Before any training has taken effect, 1.57% of users leak their credentials on their very first simulation. In a 500-person business, that is up to eight sets of login details exposed to a single convincing email, before a programme is even in place.
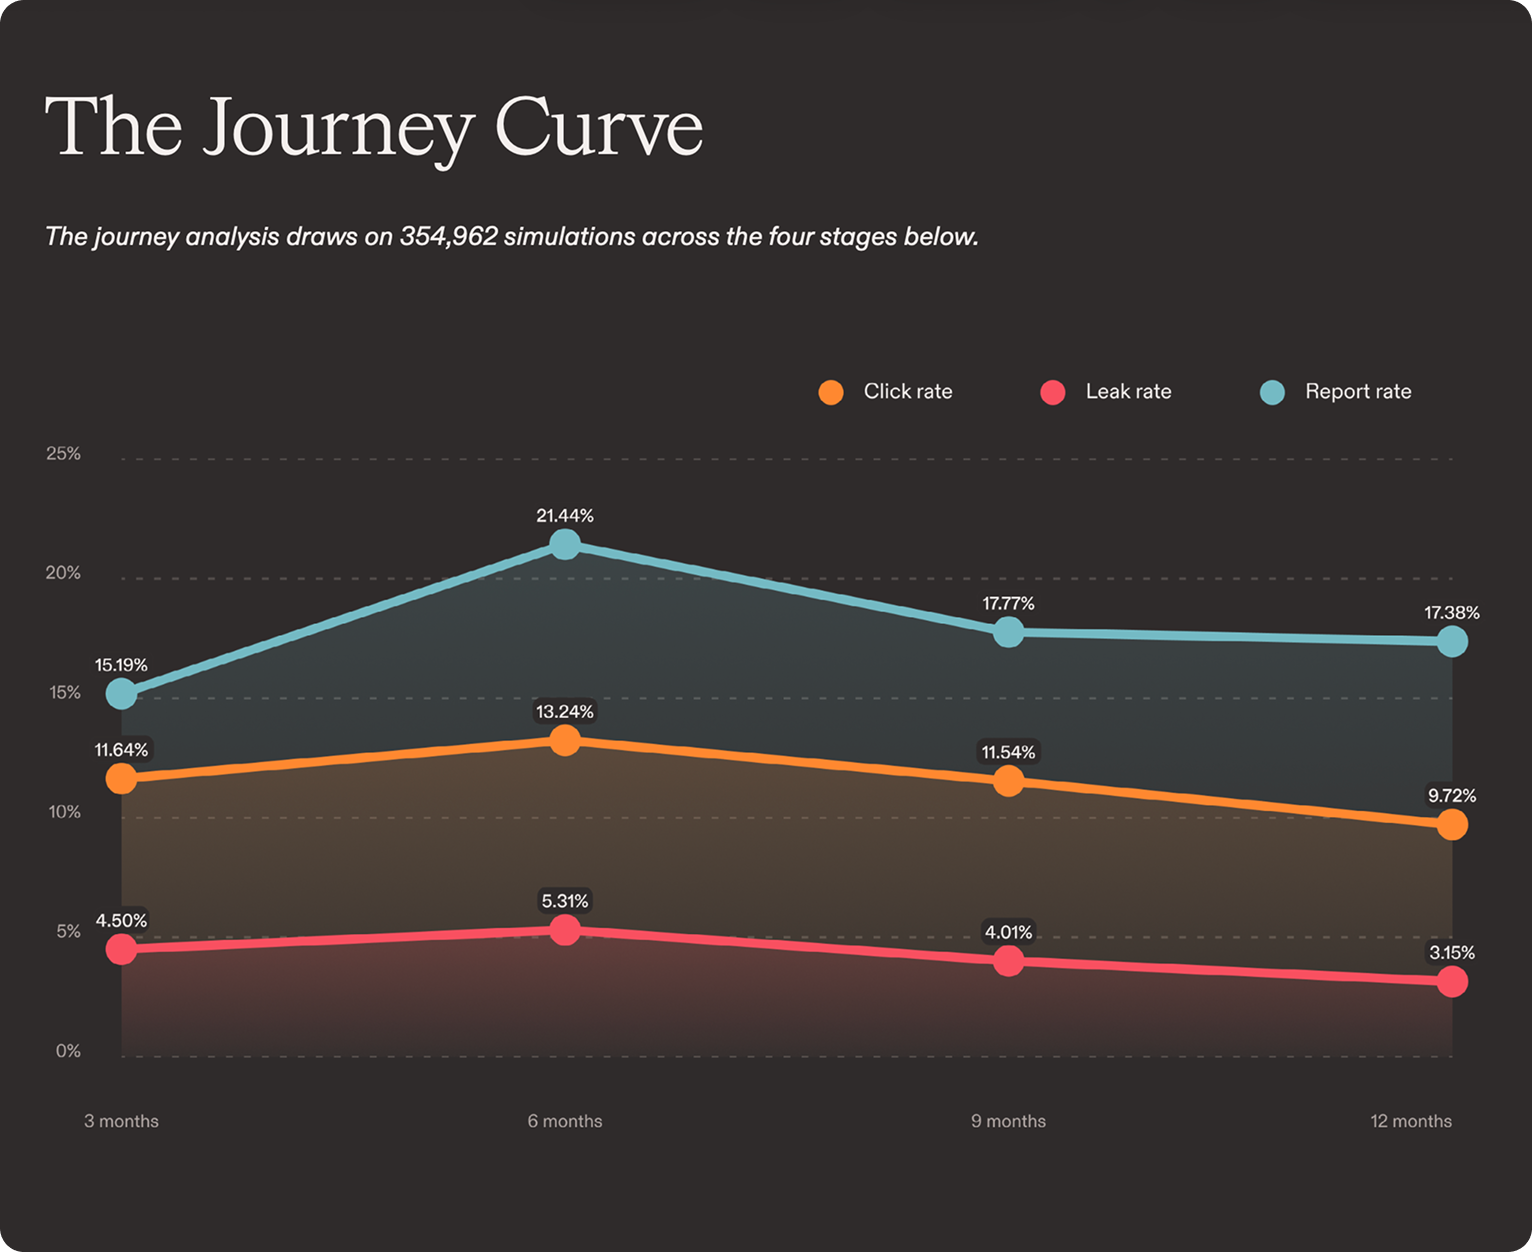
2. Behaviour does not improve in a straight line. Click and leak rates peak at around the six-month mark, the point at which testing is hardest, before falling again. The rise reflects risk being surfaced, not created. Judged from the peak onward, the trend is downward.
3. Technical teams are not automatically safe. Over the year, 30.27% of Tech Development users and 28.53% of IT users clicked at least one simulation. Knowing what to look for is not the same as acting on it when a convincing email lands mid-task.
4. The same test difficulty produces very different results. Given a near-identical mix of difficulty, cumulative click rates ranged from 26.35% in one department to 41.31% in another. A single uniform programme over-tests the strongest teams and under-serves the weakest.
5. Reporting matters as much as clicking. By the 12-month stage, users reported suspicious emails nearly twice as often as they clicked them. That shift towards vigilance is what resilience looks like in the data, and it is the behaviour most programmes never measure.
What this means for how you measure
The organisations showing the strongest signs of resilience in this dataset are not always those with the lowest click rate. They are the ones improving on clicks and leaks while reporting consistently, tested with simulations that reflect the threats their people actually face rather than a static library everyone eventually learns to spot.
That points to a different way of running a programme. Difficulty that adapts to the individual rather than being set once for the whole organisation. Testing that continues rather than resetting each year. And reporting treated as an outcome to build, because a workforce that flags suspicious emails quickly becomes part of your detection capability, not just a risk to be managed.
None of this shows up if click rate is the only number you track.
The behaviours worth measuring
Organisations do not become resilient because fewer people click. They become resilient because more people recognise attacks, report them quickly, and avoid giving away their credentials. Those are the behaviours worth measuring, and they are the ones this report sets out to make visible, across the full 12-month journey and for every major sector and department.
Download the full Phishing Behaviour Report 2026 to see how behaviour changes over the year, where risk concentrates in businesses like yours, and what the numbers mean for how you run your own programme.
To see how Pistachio builds this kind of resilience with adaptive phishing simulations that calibrate to each user, email contact@pistachioapp.com to book a 15-minute demo.
